GFChart | Image Charts Add-On
Updated on: April 2, 2025
Version 1.1.2.beta1
Single Purchase
Buy this product once and own it forever.
Membership
Unlock everything on the site for one low price.
Product Overview
Transform your data into stunning visual representations with GFChart, the ultimate Image Charts Add-On for Gravity Forms. This powerful tool allows you to create dynamic charts and graphs directly from form submissions, making your data not only more accessible but also more engaging. Whether you're presenting survey results, sales figures, or any other data set, GFChart simplifies the process. Plus, the user-friendly interface ensures that even those with minimal technical skills can produce professional-quality charts. On top of that, the customization options let you tailor the appearance to fit your brand's style perfectly.
Key Features
- Create eye-catching charts from Gravity Forms data effortlessly.
- Choose from a variety of chart types, including pie, bar, and line charts.
- Fully customizable to match your website's branding and aesthetic.
- Responsive design ensures charts look great on any device.
- Easy integration with existing Gravity Forms for seamless functionality.
- Export charts as images for use in reports or presentations.
- Real-time updates as new data is submitted through your forms.
- User-friendly interface makes chart creation simple and intuitive.
Installation & Usage Guide
What You'll Need
- After downloading from our website, first unzip the file. Inside, you may find extra items like templates or documentation. Make sure to use the correct plugin/theme file when installing.
Unzip the Plugin File
Find the plugin's .zip file on your computer. Right-click and extract its contents to a new folder.
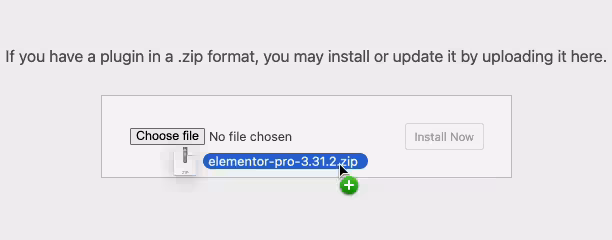
Upload the Plugin Folder
Navigate to the wp-content/plugins folder on your website's side. Then, drag and drop the unzipped plugin folder from your computer into this directory.
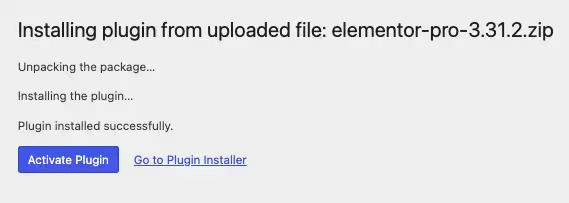
Activate the Plugin
Finally, log in to your WordPress dashboard. Go to the Plugins menu. You should see your new plugin listed. Click Activate to finish the installation.
PureGPL ensures you have all the tools and support you need for seamless installations and updates!
For any installation or technical-related queries, Please contact via Live Chat or Support Ticket.